
LabPlot
LabPlot is a FREE, open source and cross-platform data visualization and analysis software accessible to everyone and trusted by professionals.
• High-quality interactive plotting
• Reliable and easy data analysis, statistics, regression, curve and peak fitting
• Computing with interactive Notebooks (Python R Julia Octave and more)
• Data extraction from plots and support for real-time data
• Smooth data import and export (many file formats)
• Runs on Windows, macOS, Linux, FreeBSD, Haiku
- 44 Posts
- 41 Comments
 3·1 month ago
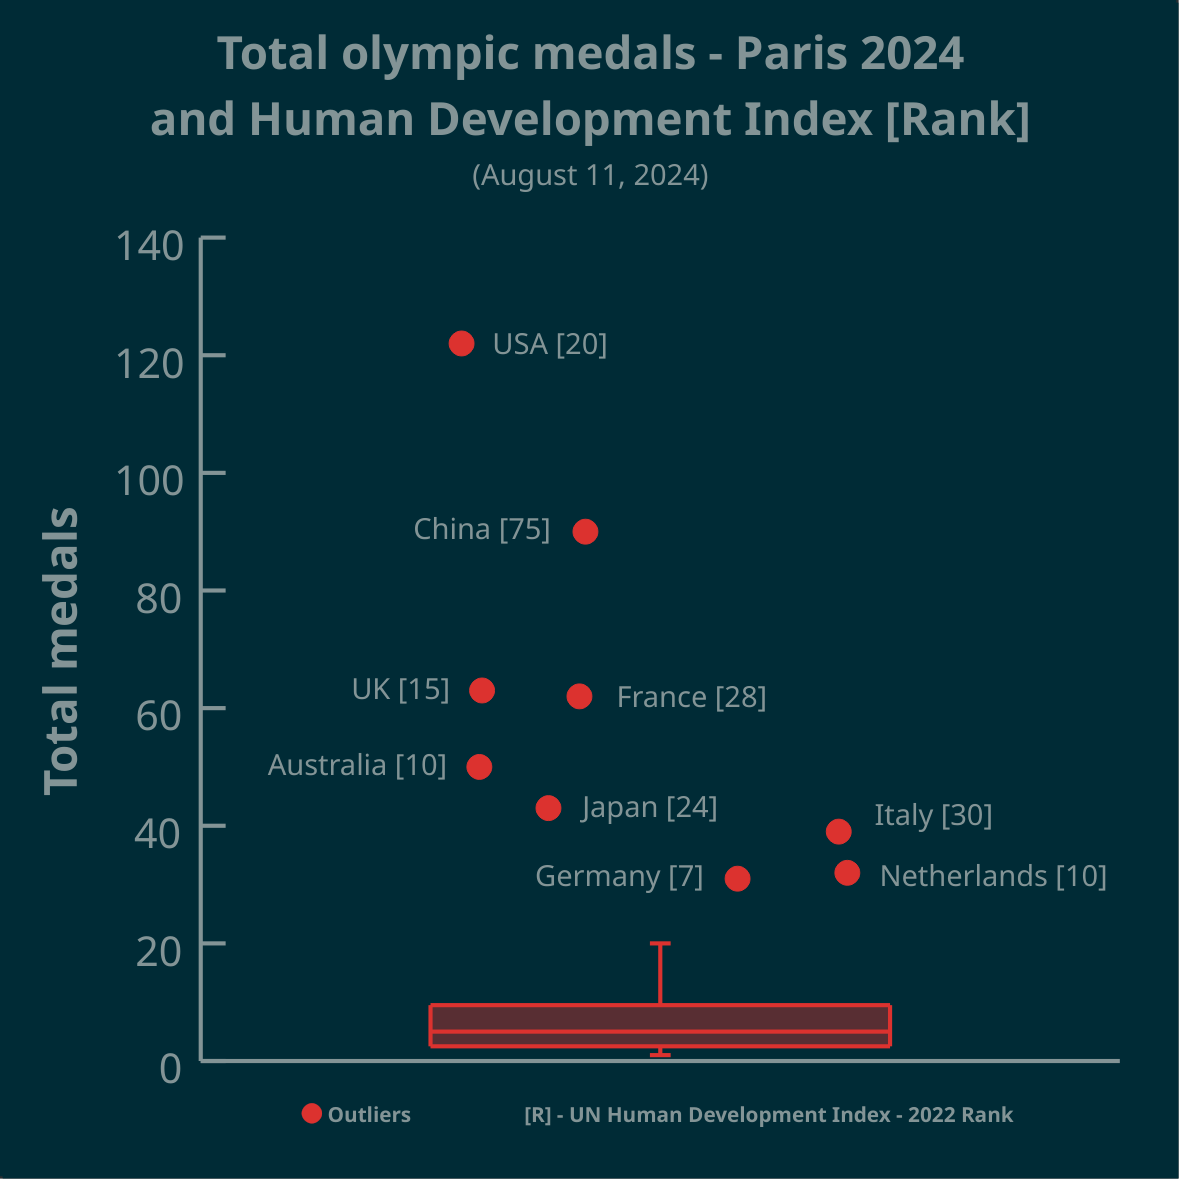
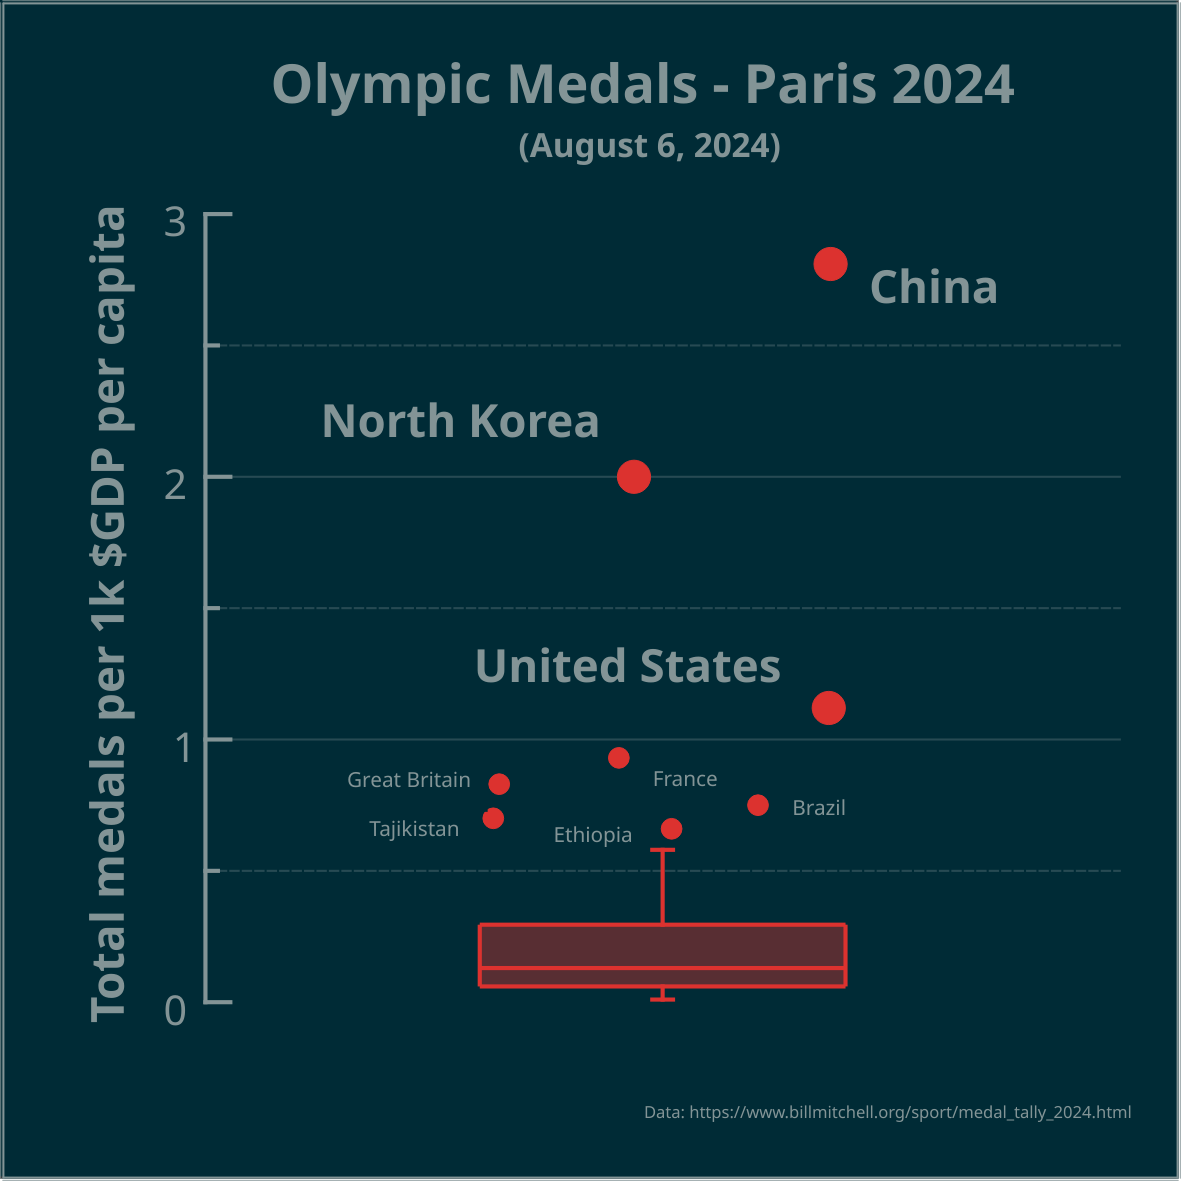
Thank you for all your comments. A jittering of data points along the x-axis was used to avoid over-plotting. But yes, a scatter plot with a boxplot attached along the y-axis (to show outliers) may be more informative in this case.
A boxplot is a 1-dimensional plot. The data points are jittered along the x-axis to make them less crowded.
More on boxplots here:
➡️ https://labplot.kde.org/2021/08/11/box-plot/
➡️ https://userbase.kde.org/LabPlot/2DPlotting/BoxPlot
We used #LabPlot, a free, open source and cross-platform data visualization and analysis software.
LabPlot’s homepage:
➡️ https://labplot.kde.org/Video tutorials:
➡️ https://www.youtube.com/@LabPlot/videos
Great question! And what’s _your_ answer?
Any exploratory plot forms a question and your comment shows how to look for answers. Thanks!
The points are jittered along the x-axis, otherwise the data points could overlap.
Australia is the next country after Ethiopia, but it’s not outlier in this case.
You can read more on boxplots here:

 0·2 months ago
14/ The last of Paul F. Velleman’s aphorisms refers to the value of conflicting explanations.
#DataAnalysis #DataScience #Analytics #Data #DataAnalytics #DataViz #DataVisualization #Science #Statistics #Math #STEM #FOSS #OpenSource #KDE #Education #Business #LabPlot
@silmaril Thank you for your feedback! And let us reiterate here that any help would be greatly appreciated 🙂
@silmaril “system version” is the version that was used by your system/distribution to link cantor against. We’ll re-phrase this part to make it more clear until we have a better and more flexible solution in place.
Yes, showing the version should be possible in the settings dialog. We added this point to our TODO-list.
@silmaril this is correct at the moment. Clearly, this not what people want to have usually and we need to change this.
To determine the required version, you can check the dependencies of executable ‘cantor_pyrhonserver’ on Linux either in your package manager or with ldd. For windows we compile and ship everything and document the required version of python in our FAQ.
@silmaril it’s decided at build/compile time. LabPlot is using Cantor internally and when Cantor is being built, the shared libraries of Python that are found in the labrary path are used and linked to. This basically fixes the version of Python used in labplot/cantor.
“CAS” generally stands for a “Computer Algebra System”. It encompasses statistical packages and programming languages like #Maxima, #Octave, #R, #Scilab, #Sage, #KAlgebra, #Qalculate!, #Python, #Julia, #Lua. You can use them all concurrently in multiple #LabPlot’s notebooks.
Please, see the attached screenshot. In this case, Python 3.12.3 is available in LabPlot on a Ubuntu machine.
@silmaril unfortunately this is more complicated… we’re not communicating with the binary like this is the case for example for Maxima and Octave but embedding the interpreter at runtime. So, our binaries are linked to python’s shared library. This is done at build step and this is the reason why we can only work with the “system version” of Python. This is an important topic that was raised to us already multiple times and we hope we can start working on it in the near future.
@silmaril actually we support Python3 only and the documentation is probably outdated. Where did you read pyrhon2?
Working with a custom venv in LabPlot is not possible yet.
9/ Wake up: It’s time for meditation 🤔 Here is another of Paul F. Velleman’s Aphorisms for Data Analysis to contemplate on:
#Aphorism #DataAnalysis #DataScience #Data #DataViz #Science #Statistics #Mathematics #Math #STEM #LabPlot #FOSS #FLOSS #OpenSource
@labplot@lemmy.kde.social
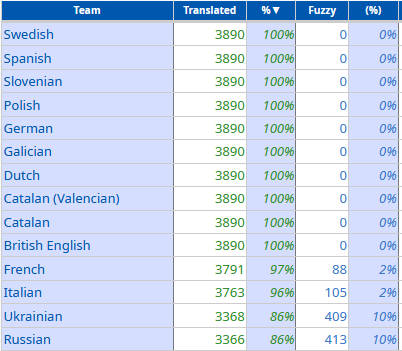
#LabPlot is now also fully available in Ukrainian and French! Thank you ❤️🙂
The following translations still need some work… And other languages need a bit more work 😉