
The original post: /r/web_design by /u/summer_glau08 on 2025-03-11 12:59:47.
Sorry if this is not the right place to ask, but hopefully you can give me some leads. I am trying to create an interactive chart (very similar to timeline) on my website. Something like this, but interactive/zoomable.
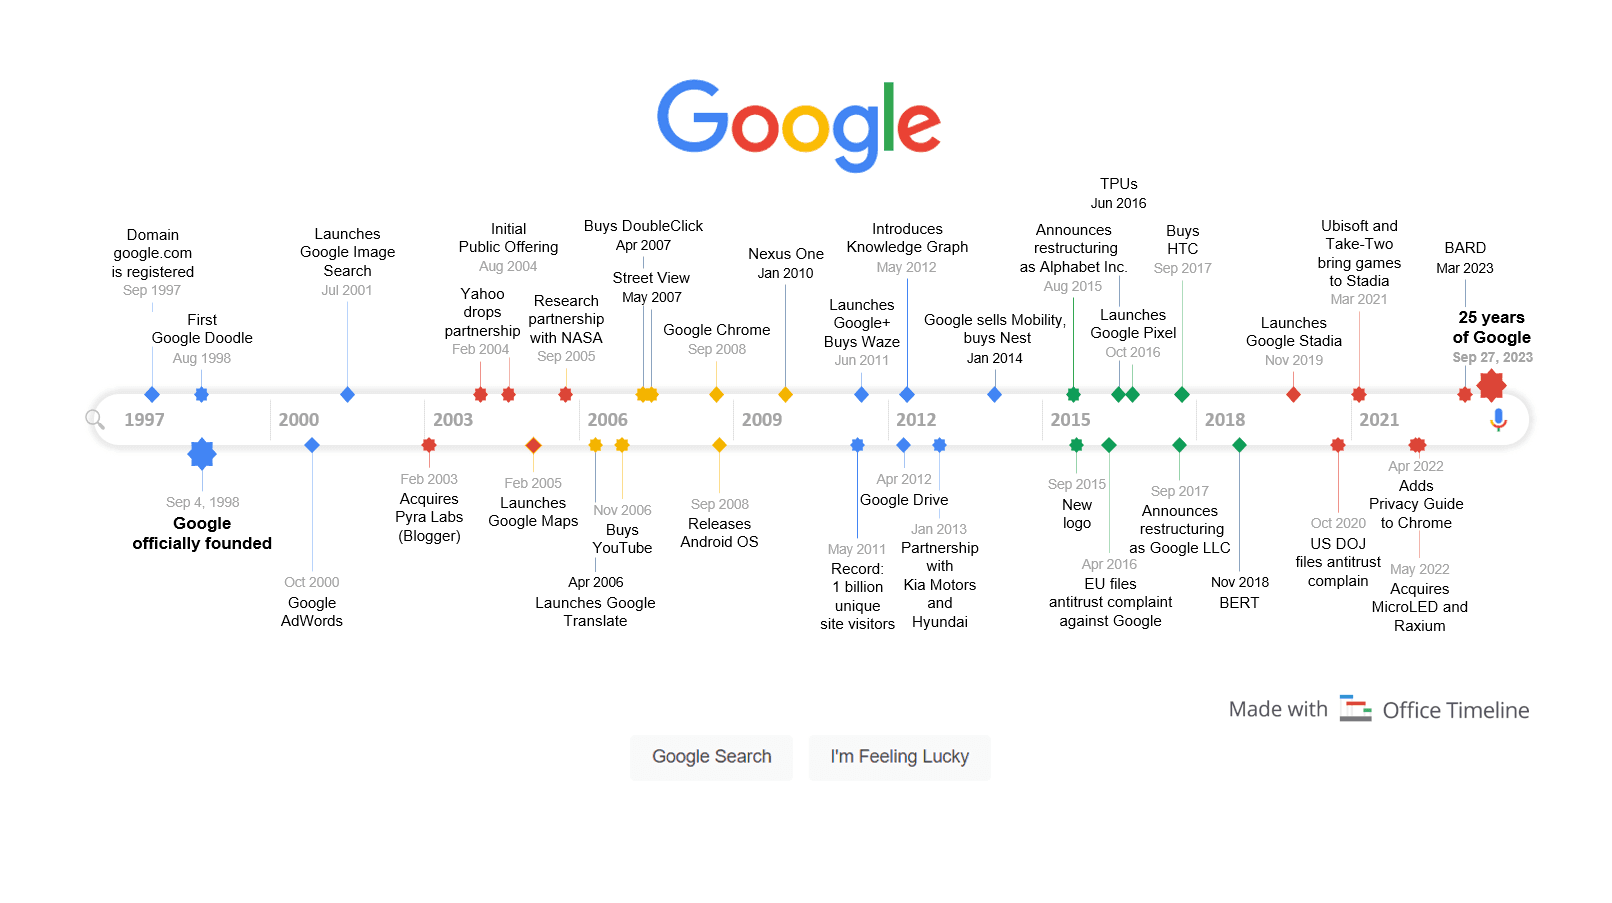
For the sake of example, I want to go from 0 to 100 on a single dimensional line. On this line, there will be content which can be a single point (say 20.1) or a range (30.4-35.3).
I would like the user to be able to zoom/scroll and the data points disappear/appear/cluster at appropriate zoom level.
Finally, each content point should be clickable to reveal further information and links.
Are there tools/libraries/examples of what I have in mind? It can be a standalone webpage (apart from links) and does not need to integrate into a CMS or anything.