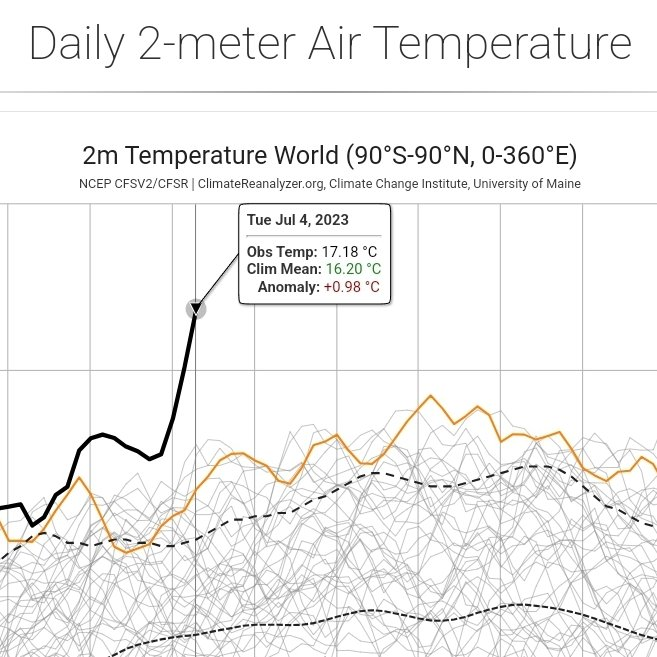
kinther@lemmy.world to Collapse@lemmy.mlEnglish · 1 year agoRemember yesterday's global air temperature record? It got broken again, this time by 0.17°Clemmy.worldimagemessage-square5fedilinkarrow-up19arrow-down10
arrow-up19arrow-down1imageRemember yesterday's global air temperature record? It got broken again, this time by 0.17°Clemmy.worldkinther@lemmy.world to Collapse@lemmy.mlEnglish · 1 year agomessage-square5fedilink
minus-squareguriinii@lemmy.worldlinkfedilinkEnglisharrow-up1·1 year agoMan, look at that jump. All graphs from this year have been like that and a similar timescale. North Atlantic sea surface temperature and Antarctic sea ice extent anomaly come to mind


Man, look at that jump. All graphs from this year have been like that and a similar timescale. North Atlantic sea surface temperature and Antarctic sea ice extent anomaly come to mind