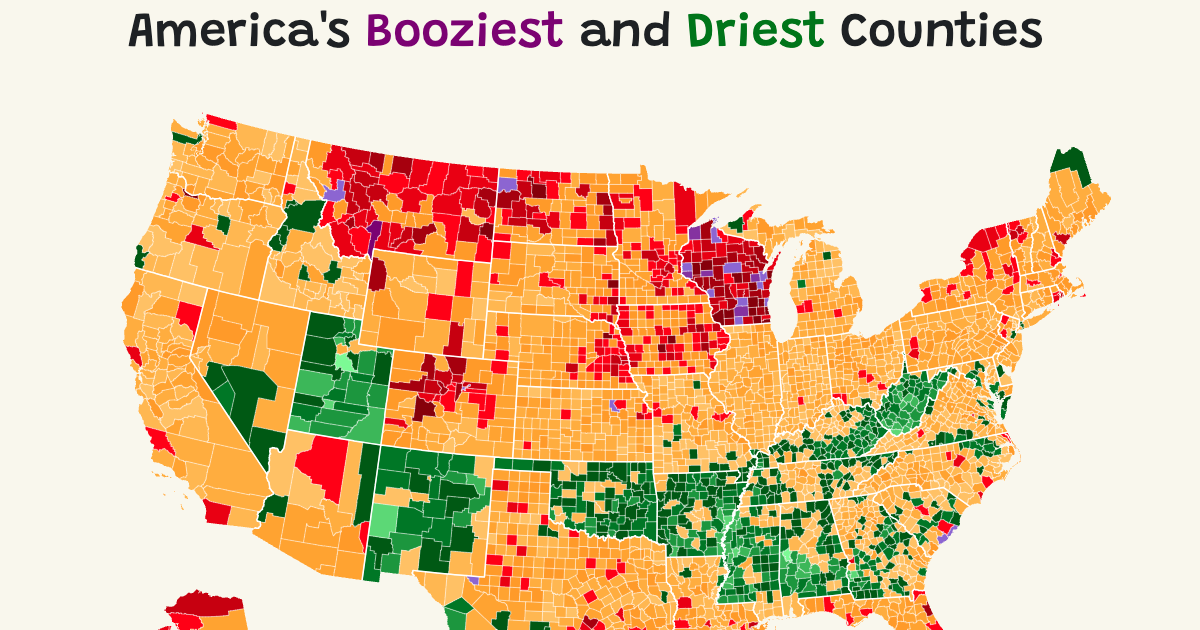
This doesn’t look right - why do drinking patterns follow some state borders like that? Culture doesn’t vary sharply across state lines, and state laws regarding liquor aren’t that different…
The map leverages data from the latest annual datasets of the CDC’s Behavioral Risk Factor Surveillance System and the County Health Rankings & Roadmaps (CHR&R) program.
Is this a combination of several separate sets of data (e.g. one for Texas and another for Oklahoma) which had different methodologies? Why else is Oklahoma (including its narrow panhandle) so different from both Texas and Kansas?
Looking at how it’s distributed, I wonder if it’s a correlation with dry (as in, alcohol sales are restricted) counties and states. For example. I don’t think Utah even allows alcohol sales (over 5% beer) on Sundays.
Using Wyoming as an example, all of the red spots are cities, everything else is miles upon miles of mostly empty BLM land. That one spot that’s super red? Laramie, the town with the only 4 year university in the state, with a direct path to Fort Collins just south of that, another massive college city. You can also see the Grand Valley lit up because of all of the Mormons stopping in Delta or Grand Junction to buy booze to bring home (dry counties abound in Utah and Idaho)
deleted by creator
The difference is real, Wisconsin has the Tavern League. Powerful group and a big reason why theres no legal weed in Wisconsin.
Meanwhile it’s surrounded by states with legal weed.
Wisconsin always wins these.
lol @ Wisconsin. I lived in Milwaukee for ~2.5 years and that 100% tracks… MKE is decently fun in the summer, but any other time of year and nobody does jack shit except drink.
Fuckin’ Wisconsin.
Wisconsin, are you ok?
No, as a person in a magenta county this map tracks.
The state has a problem with alcohol, much of the culture revovles around it.
Bars have so much power here they successfully lobby to keep weed illegal. They’re like a cartel.
Hell yeahhh!
Very much no. If you search for police bodycam footage on YouTube you will find a large number come from Lacrosse, WI.
At least they keep the cameras on
This is just a population map, right? Can you order the data per-capita?
It’s % of the population that drinks.
Basically a graph of: “where did the Scandinavians migrate?”
I lived in Wisconsin and that checks out.
On another note, I need that font from the headline.You can download it here: https://fonts.google.com/specimen/Grandstander
What’s the deal with New Mexico?
Old people can’t drink with their medication.
THIS IS UTAH. SEND MY PRIZE.
Napa:


